Analyzing 1inch Liquidity Pools with the Covalent API and Power BI

* Information: the data was retrieved on 31.05.2021
Introduction
In May of 2021, the Covalent x 1inch DnD hackathon took place. Covalent indexes various blockchains such as Ethereum, Avalanche C-Chain or Binance Smart Chain. Similar to The Graph, Covalent allows the developer to query information from these blockchains in order to gain insight into the data stored. However, Covalent offers a regular REST API interface where the user can submit GET requests instead of requiring the development of subgraph queries.
Requesting information from the Covalent API
Since the 1inch network resides on the Ethereum blockchain and Binance Smart Chain, we could inspect either. The problem statement of the hackathon stated to inspect the liquidity pools on 1inch (the official list of liquidity pools based on the Ethereum blockchain can be seen on the 1inch apps website).
Covalent offers various endpoints. The class A endpoints offer general blockchain information such as the token balance of a wallet, transactions performed by an address, or the log events by a topic hash.
By building together the URL, we can either request information in a graphing tool like Microsoft Power BI or Google Sheets.
The majority of the graphics where created using information fetched from the “get token balances for address” endpoint.
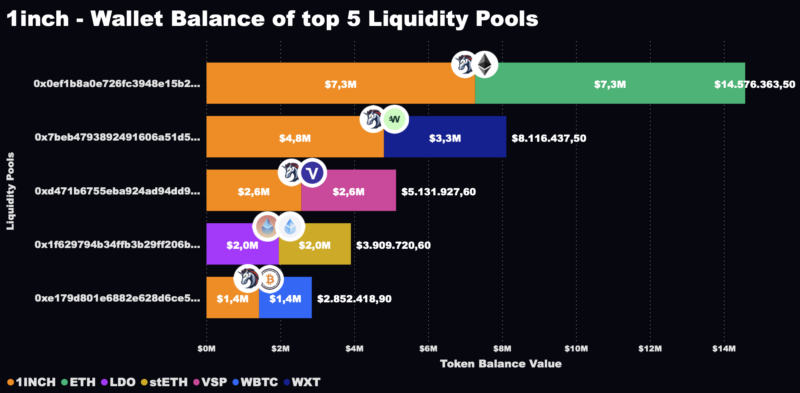
Wallet balance of top 5 liquidity pools
When looking at the top 5 liquidity pools on Ethereum based 1inch, we can see that the 1inch token itself is the counterpart in a pool four times. The 1inch-ETH pool is by far the largest and contains approximately $14.5 million USD in value, followed by the 1inch-WXT pool with $8.1 million and the 1inch-VSP pool with $5.1 million.

Distribution of top 10 liquidity pools
The 1inch-ETH pool contains approximately 1/3 of the total liquidity provided by the top ten liquidity pools. The top 5 liquidity pools provide about 75% of the total liquidity.

Share of pool size of top 10 liquidity pools
As seen in the wallet balance of the top 5 liquidity pools, the 1inch token was represented in four of the top 5 liquidity pools. It is no surprise that the 1inch token is represented in the top 10 liquidity pools with a staggering 38% of liquidity, totalling $20.77 million. The 1inch token is followed by Ether, having a share of $13.3 million and 24% of the total liquidity. Out of the 200 something liquidity pools on 1inch, the 1inch token was represented in 25 token-pairs.

Conclusion
Fetching data with the Covalent API and creating graphs in Power BI proved fairly simple. If you have questions or comments, feel free to reach out to me via email or on the GCR or Covalent Discord channels.
-
This is a great article!


