What Time Does Bitcoin Get Volatile? An Analysis of BTC Average Hourly Volatility

This is a contributing article from Yuya Hasegawa, a Market Analyst at bitbank, inc..
Join the Global Coin Research Network now and contribute your thoughts on Asia!
Times mentioned in this article are based on JST (UTC +09:00) and 24-hour clock.
Measuring Volatility from Hourly Candlesticks
Bitcoin (BTC) has its markets scattered across the globe, and those markets are open basically 24/7, including weekends, but is there a particular pattern in its price volatility due to geographical factors like in forex markets?
Although it depends on the currency pairs, in the cases of major pairs like EUR/USD and USD/JPY, the markets tend to get volatile around the time when the TTS/TTBs (fixed rates at Japanese financial institutions: announced around 10:00), some important U.S. economic indicators (21:30 in summer and 22:30 in winter), and fixed rates in the UK (London Fixing: 0:00 in summer and 13:00 in winter) are announced. Also, the start of trading sessions in Eurozone, the UK, and the US (roughly at 15:00, 16:00, and 22:00 respectively) are said to be the times when trading becomes active and the markets become more volatile.
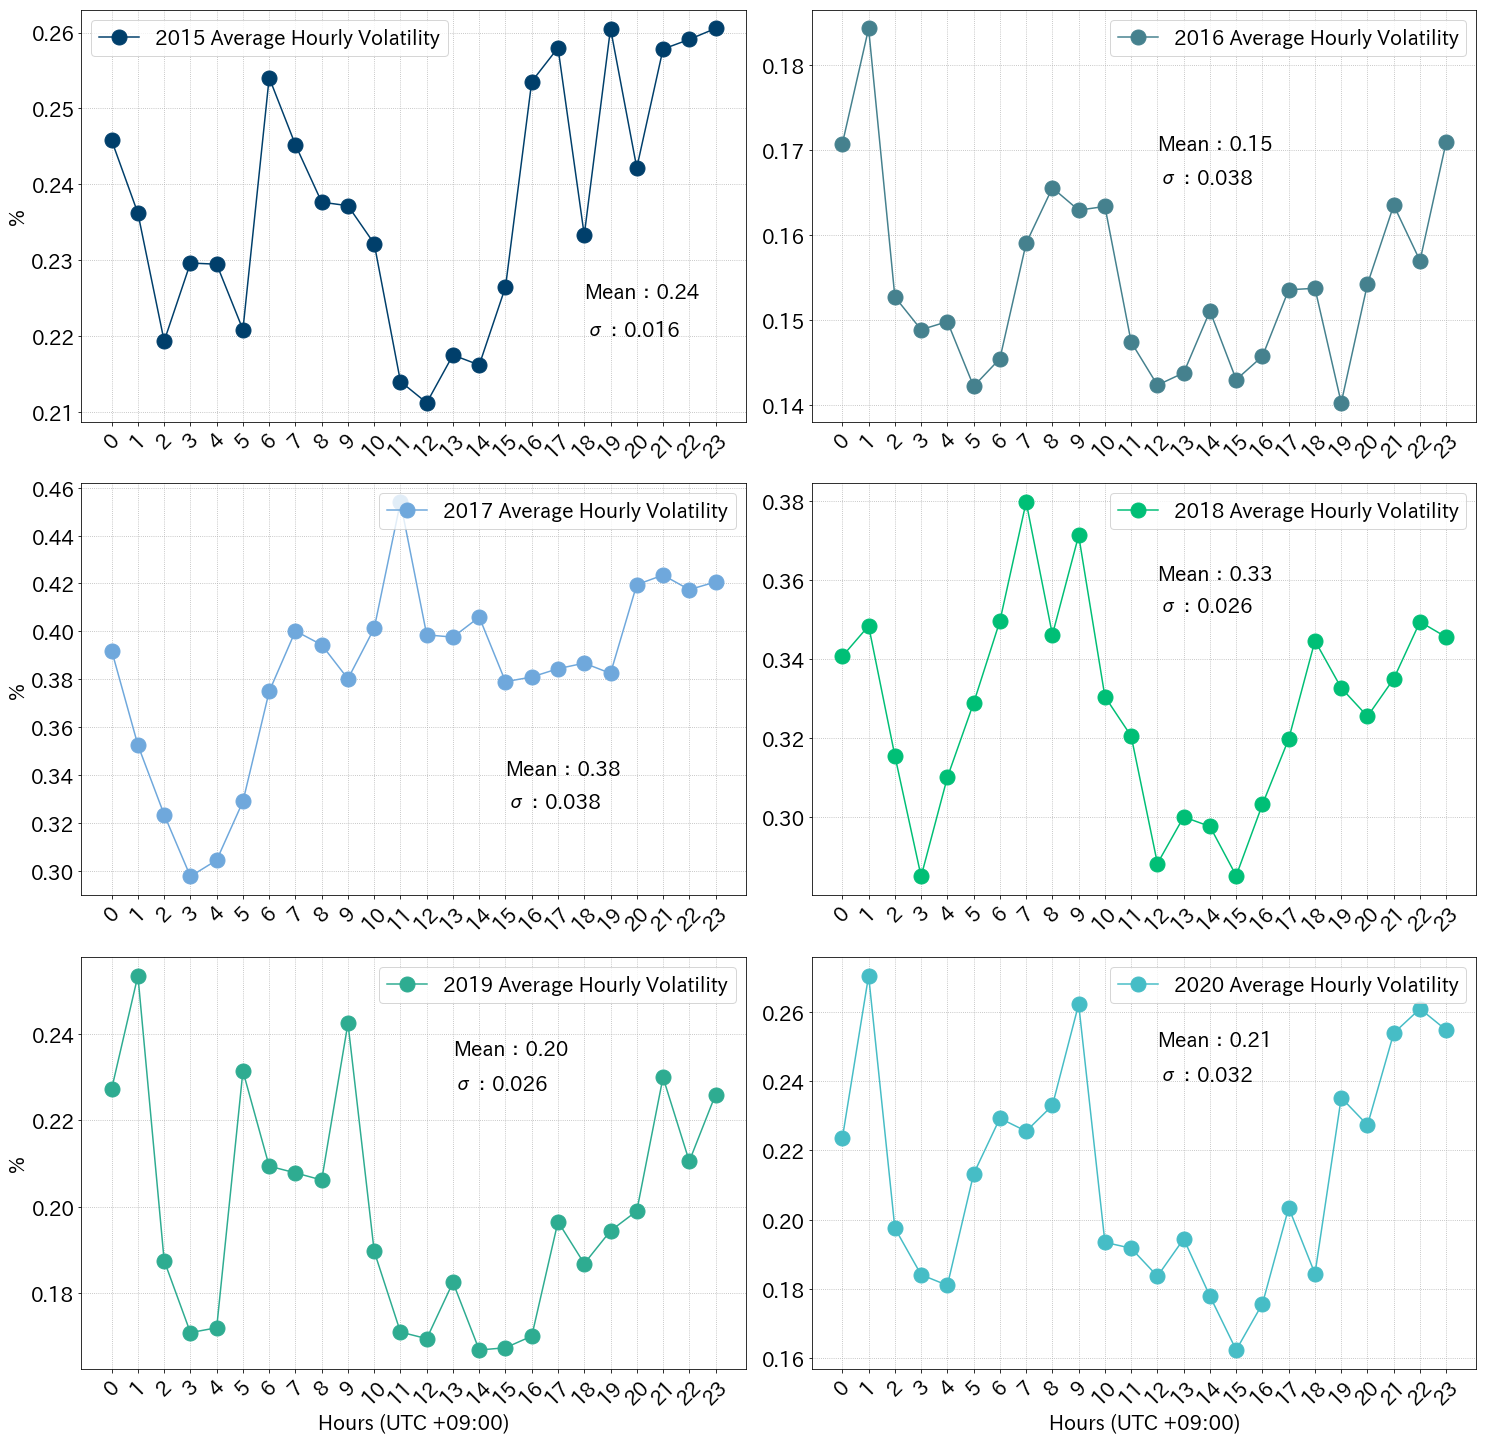
Fig.1 below shows BTC/JPY’s average hourly volatility by year from 2015 to 2020 (until August 25). Unlike historical volatility, which is calculated from the standard deviation of past returns, in this analysis average hourly volatility is calculated from dividing hourly price ranges (hourly high — hourly low) by each of their mean.

Source: bitbank.cc/en
With the exception of the year 2017, the pattern is surprisingly similar to that of the forex market laid out above, with a relatively low volatility during Tokyo sessions and higher volatility when European, the UK, and the US sessions overlap.
Although BTC trading in EUR accounts for less than 3% of global volume (as of August 25, according to Coinhills), not only Eurozone houses one of the major financial markets and some crypto-friendly countries in the West, users can access to more liquid non-EU exchanges depending on their KYC policy, so it is easy to imagine a number of European and even British traders are trading BTC/USD or BTC/USDT pairs.
In addition, around the time when European session begins, which is in early evening in Japan, traffic to our website usually starts to increase gradually, so Japanese retail investors may be contributing to the volatility as well.
Although the dollar accounts for over 70% of BTC’s volume against all legal tenders combined (as of August 25, according to Coinhills), strangely, the price movement tends to settle down in the middle of NY session. It is not clear if it is because the European and the UK markets close around these hours or because Japanese traders are finally going to bed, but in any year, this tendency is only temporary and towards the end of the NY session, the volatility rather suddenly returns and it keeps relatively high levels until the beginning of Tokyo session.
More Articulate Pattern after the 2017 Bubble
The pattern above seems to have gotten clearer after the initial coin offering (ICO) craze and the crypto bubble of 2017, and the charts for 2018 to 2020 are all very similar in shape.
The reason for this is probably because the bubble of 2017 attracted more and more experienced retail and institutional traders to the crypto market that the market started to be influenced more by fundamentals and technical theories widely used in traditional financial markets.
For example, from 2018 to 2020, the volatility between 9:00 and 10:00 is noticeably high. This particular window of time is right after the previous day’s closing price is determined, and the closing price plays a very important role in technical analysis.
In the Dow theory, an intraday price breaking above the recent high (or below the recent low) is not considered a bullish (bearish) signal. In general, it is when the daily price closes above the recent high (or below the recent low) , a bullish (bearish) signal is confirmed. This holds true for other trend-base technical indicators like moving averages as well. So, the spike in BTC’s volatility during 9:00 to 10:00 can be attributed to a number of market participants taking new positions and/or closing their positions depending on indicators of their choosing.
In addition to this, from a technical standpoint, the cycle theoy’s alpha cycle, which utilizes four-hour candlesticks, may be employed by a number of short-term traders, as there has been a tendency for the volatility to rise in the four-hour time frame (during 1:00 to 2:00, 5:00 to 6:00, 9:00 to 10:00, 13:00 to 14:00, 17:00 to 18:00, and 21:00 to 22:00). Even during Tokyo session, when the volatility is typically low, the volatility during 13:00 to 14:00 slightly jumps.
In addition, in more recent years, the market seems to be showing more substantial reaction to the US economic indicators, as the volatility during 21:00 to 22:00, notably when the jobs data, which is one of most important fundamental indicators, is announced in the US, is significantly higher than volatilities in a couple of preceding hours.
What time is the best to trade after all?
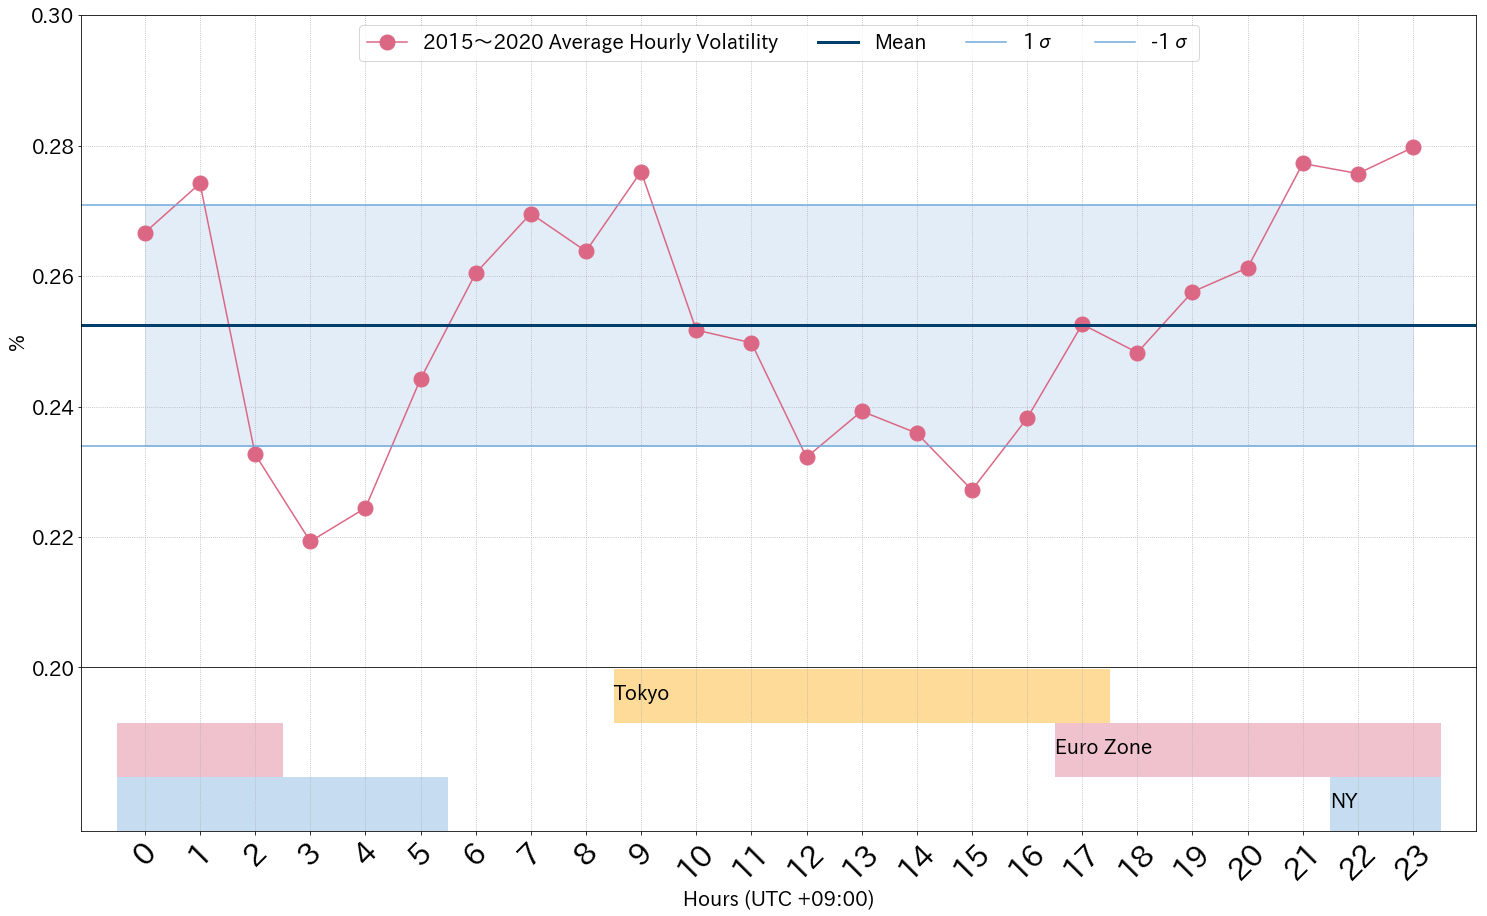
If we combine each year’s data to calculate the average hourly volatility since 2015, based on the dataset and the methodology in this analysis, we can see that bitcoin tends to be particularly volatile during 1:00 to 2:00, 9:00 to 10:00, and 21:00 to 23:00 as the volatility during these hours exceeds one standard deviation of the average (Fig. 2). On the contrary, during 2:00 to 5:00, 12:00 to 13:00, and 15:00 to 16:00, bitcoin tends to settle down.

Source: bitbank.cc/en

Source: bitbank.cc/en


