The Power Law is The Investment DAO’s Best Friend
Inspection of startup data shows that only a small number of investments drive most of the returns. Startup investors realize early that they have considerably more misses than hits. In fact, one can safely conclude that venture is a business of extreme outliers where a very small percentage of the startup portfolio compensates for the losses from most investments, and on top of that generates the extra alpha. With this backdrop a key conclusion may appear then to pay solely attention on the question of identifying extreme outliers.
This article takes a different approach. With hindsight, a startup investor even with the best diligence, most profound research and differentiated support tailored to each startup portfolio company or project can’t possibly know in advance which one will turn out to be the outlier investment. Instead, we try to identify the “stochastic law” behind this outlier phenomenon and then ask ourselves what this means for portfolio construction, optimal holding period and alpha generation.
Returns in startup companies are distributed according to the Power Law: that’s the probabilistic term for saying that the lion’s share of returns is earned from a small number of investments. Once equipped with this toolkit, we can ask ourselves the following four questions:
- “What is the chance of an outlier in a startup fund?”
- “What return multiple can you expect for such an outlier?”
- “What is the optimal portfolio size?”
- “What is the optimal holding period?”
We’ll address the first question by using historical evidence from established venture capital firms. The other three questions fall in the realm of the Power Law and we address them coherently within that framework. Overall, one observation holds true: repeatable great performance requires principled portfolio construction that is based on an intellectually honest assessment of the odds. Ultimately, outlining and explaining those odds is the goal of this article.
Lastly, an epistemological note: using a model such as the Power Law is always simplistic as the investing is more complex than what the model can possibly capture in myriads of ways. The model glosses over many relevant details that practitioners are all too familiar with (timing of exit is clustered and dictated by fund raises, investment performance depends on macro backdrop, differentiated and sustainable support is easier said than actually implemented etc.). Nevertheless, the Power Law can help filter out noise and focus on the essential aspects of startup investing. If the reader acknowledges this and accepts that this entire exercise still rests more on “art than science” after all yet leveraging on quantitative and mathematical insights, the lessons learned are invaluable for investment success.
“What Is the Chance of an Outlier in a Startup Fund?”
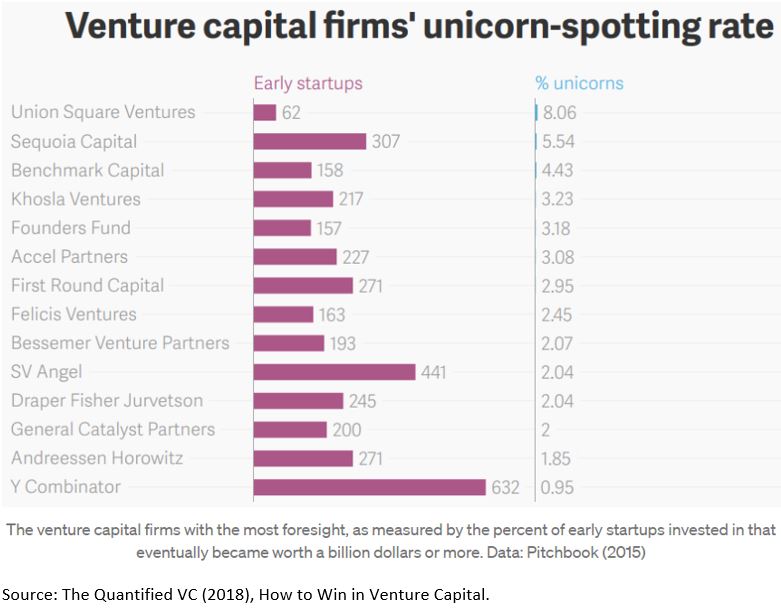
The odds to have an outlier in a startup fund are very low. And it is not just funds with comparably poor track record that will face these dismal odds. Similarly, the most stellar funds with a long-term impeccable track record face the same incredible uphill battle to find those outliers, let’s say in form of these mythical creatures as unicorns. Even among the top venture funds there is considerable variation in the spotting rate of unicorns. That spotting rate of top players in the space can vary between less than 1% (YC) and slightly more than 8% (Union Square Ventures).
A similar picture emerges when defining an outlier event as a startup investment that generates a return of at least 10x. The summary chart below covers a longer time period and a much broader cross-section that is representative of the entire US venture investment universe over 30 years. The overall average probability of hitting a 10x MOIC homerun is a mere 5%, and unsurprisingly, the majority of deals return less than the invested capital. In other words, venture funds and startup investment DAOs equally will face the same Power Law when they try to generate their alpha: only about 2-3 investments out of 100 will in the end not only cover the losses of the 50% loss making investments but also be responsible for the extra alpha generation for their clients and community members, respectively.

The Power Law – Some Basics
The observation above that a single outlier company can make an entire investment fund suggests that the Power Law is at play. The idea of applying the Power Law to venture investing is not new but was nicely discussed elsewhere (see here, here, here, or here). What is new here is that we will also discuss investment horizon in the context of the Power Law and discuss its implications across varying degrees of its strength (their extremeness of the tail events). This will become particularly relevant when we classify various asset classes in finance, amongst them also cryptocurrencies and NFTs, in terms of their respective degree of the Power Law.
The most important thing about a Power Law distribution is the alpha. The alpha is a parameter that captures the strength of the Power Law at play. The smaller the alpha, the more extreme the outlier event. An intuitive way to better understand the Power Law distribution is to take a look at some outlier events and then put those outliers into the broader context. Two examples may help illustrate this (see Taleb, 2020):
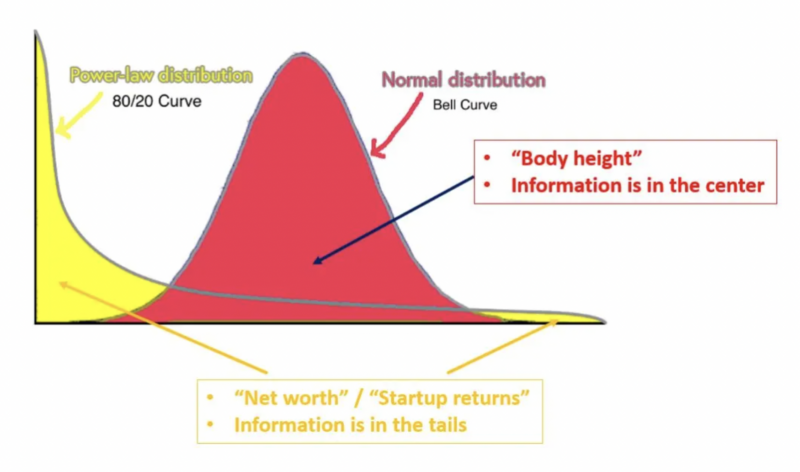
Situation “Body Height”: Assume you randomly meet two people, and their combined body height is 4.1 meters. In this situation, the most likely combination is that both persons are 2.05 meters tall, and not one person is 10 centimeters tall and the other person 4 m.
Situation “Net Worth”: Again, you randomly meet two people, but in this case you study their respective net worth. You find out that their combined wealth is $36mm. In contrast to the above situation with the body height, the most likely combination is that one owns $35,999,000 and the other owns $1,000, and not both own $18mm.
These two situations illustrate nicely the relative importance of averages and outliers, respectively. Whereas in the Situation “Body Height”, the average is the concept that contains most information, in the Situation “Net Worth”, it is the outlier that is most informative about the subject matter at hand. And returns from startup investments belong to this latter class. This can be nicely illustrated graphically with two respective distribution functions. Our world of startup investments, cryptocurrency and NFTs is the world that belongs to the yellow distribution, the Power Law distribution.

Once we accept this fact, some important implications arise:
- With thick tailed distributions, extreme events away from the center of the distribution play a very large role. In fact, that’s the only information we’re after and want to understand better.
- A misconception is that the “fatter” the tail (that bit on the very right-hand side in the yellow curve), the higher the probability of outsized events. That’s however not necessarily true. What matters more is that these outliers are more consequential. In the most extreme case, the fattest tail distribution has just one very large extreme outcome, rather than many departures from the average.
- By nature of outliers being rare, mere reliance on empirical data leads to misconceptions and wrong conclusions. We need the theoretical underpinning of the Power Law to make intelligent extrapolations about what to expect when an outlier materializes, or in other words, what can we expect the MOIC of a startup investment to be once it’s made already 10x. Empirical data alone won’t help us much to answer this question.
Cryptocurrencies and NFTs Are The Asset Class with The Fattest Tails
In order to answer the questions outlined at the outset about expected outlier return multiples, optimal portfolio size and holding period, we need to know what the alpha of the Power Law distribution is for startups in general and the cryptocurrency and NFT sectors in particular.
Qualitatively, with the Power Laws, the lower alpha is, the more extreme the outliers of that phenomenon are. In table below, I present a couple of “social” phenomena with their associated alphas, sorted in ascending order. The top phenomena are characterized with most extreme outcomes whereas the bottom ones, yet still part of the Power Law family, have more muted outliers. In addition, I highlighted in gray those phenomena that represent a financial asset class.
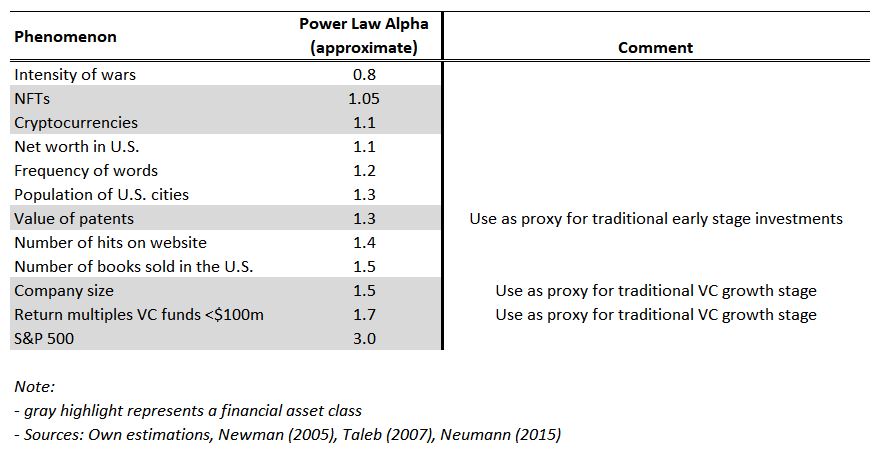
The most extremal phenomenon are wars, typically measured in people falling victim of belligerent conflicts relative to the population size (for example the Thirty Years’ War had a death toll of 20% of the entire Central European population by some estimates). The power law alpha of less than one implies that – mathematically – there even doesn’t exist an average: of course, I can calculate an average using empirical data, but that number is meaningless as it doesn’t contain any valuable information. Instead, at one point in the future there will be an extremal event that will dwarf the existing historical maximum outlier by a massive multiple and therefore meaningfully change the existing average.
Among financial assets, cryptocurrencies and NFTs have the lowest Power Law alpha. For investment purposes, a lower alpha is better as expected return multiples are higher. That massive upside however is often constrained by finding enough companies that can generate the required amount of high growth within the investment holding period.
We will now use the information about the Power Law alphas and address the questions about expected returns, optimal portfolio size and holding periods and discuss the implications of the low alpha for crypto and NFTs in comparison to traditional startups and VC growth funds.
“What Return Multiple Can You Expect for Investment Outliers?”
With the alphas from the table above, we are now equipped with the information we need to answer this question for every financial asset class.
We introduce two aspects of the Power Law – extrapolation and scalability/self-similarity – through which the tail index alpha operates to calculate excess return multiples of investment outliers.
- Extrapolation: Future outliers and maxima are poorly tracked by past data. We therefore need a framework for some intelligent extrapolation; and the Power Law is such a framework. The naively obtained “empirical” distribution will reveal the biggest outlier, the current maximum (e.g., Ethereum with, say, 12,000x). But, if that investment is the current maximum outlier, it had to have exceeded what was the previous past outlier, and the empirical distribution would have missed it. For thick tails, the difference between past outliers and future expected outliers is even larger than thin tails. The tail exponent alpha captures by extrapolation that low-probability deviation not seen in the data.
- Scalability / self-similarity: This feature of the Power Law is best described with an example. Let’s say you invest in a startup with a $10m post-money market cap, and another one with a $100m post-money market cap. Scalability is simply defined by the property that the relative probability of exceeding 10x (or any multiple) for the first investment is the same as exceeding 10x (the same multiple) for the second investment. This property is however only at play to some degree as at one point the upside to an investment is capped by the size of the economy, say.
We saw earlier that only 5% of all startup investments over the 30-year period from 1985-2015 generated a return of 10x or more. But what return multiple did those successful startup investments generate on average? We can answer this question by using the Power Law alpha and then extrapolate the investment multiples by each sector.
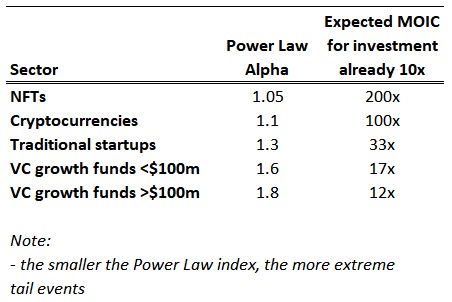
Expectedly, NFTs with their lower alpha have the highest return multiple: if you owned an NFT that is already up by 10x, ‘on average’ you can expect this NFT to generate a 200x performance. Similarly, cryptocurrencies would return 100x on average contingent on their current performance for having already 10x’ed. Furthermore, conservatively, even if all the other 95% of your investments returned zero, you will still be up on average by 10x and 5x for your NFT holdings and cryptocurrency holdings, respectively.
Viewed from the perspective of the Power Law, compared to traditional startups and VC growth funds, NFTs and cryptocurrency projects play in a different league.
“What Is The Optimal Portfolio Size?”
The Power Law reveals itself very slowly, which makes sense as we are dealing with outliers. And outliers are rare events that take time to materialize. This observation has direct implications for the portfolio size of startup investments. At a given alpha for the Power Law, the more investments you make the better, because the average return multiple increases with the number of investments, and so does the highest outlier.
We illustrate this by targeting a 10x multiple for the portfolio and calculate the probability of attaining this benchmark with one investment as we increase the portfolio size. This probability continues to grow with the portfolio size, with the chance of hitting a 10x outlier almost doubling from 20 to 50 deals. This suggests that diversification benefits in portfolio construction are very tangible in the presence of the Power Law.
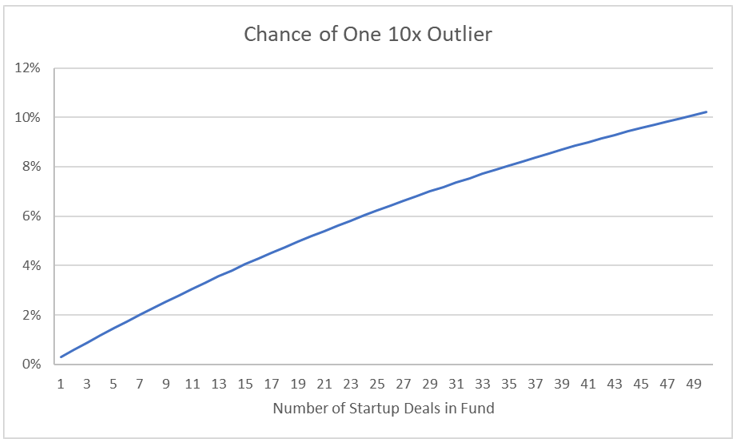
However, this view is very simplistic as there are limits to grow the portfolio infinitely from a practical point of view. The right portfolio size is still a judgment call based on risk tolerance, time horizon, investor base, opportunity set – and most crucially – the fund’s support model. Portfolio construction requires weighing the benefits of diversification against the fund’s ability to provide differentiated and tailored support to its high-quality investments. Actively helping the companies, you invest in increases their chances of success. The portfolio size then becomes a matter of bandwidth of the fund that needs to strike the right balance of increasing the probability of hitting a homerun by steadily increasing the portfolio against the number of companies the fund can actually help at any given time.
“What Is the Optimal Holding Period?”
The Power Law itself is not just a given. Instead, it can be modeled as the result from a simple mechanism that relies only on the growth of the startup company and the time to exit the investment. It also says that as the company growth rate gets larger and expected time to exit becomes longer, the tail of the Power Law distribution gets fatter. The more patient you are as an investor, the more outsized the outliers can possibly become and hence the larger your investment upside.
This is just another way to describe what’s commonly known as the Lindy effect. It basically states that if something has been around for some time, then the chances are it’s going to be around for a while. For instance, the longer a technology has been around, the longer it’s likely to stay and even eventually grow to a 10,000x investment that startup investors are shooting for.
Empirical data suggests that the average annual startup growth rate is somewhere at 30%. We will use this assumption to illustrate how time can become a startup investor’s friend. The more patient the investor is, that is, the longer his investment horizon, the lower the Power Law alpha he’s exposed to and hence the higher his investment multiples are in case of an outlier.
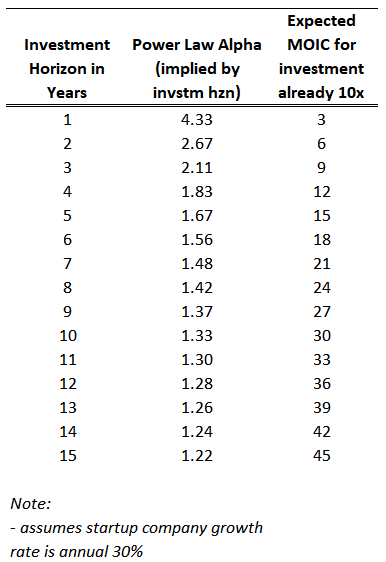
With a classical venture fund having a cycle of 7-10 years, its exposure to the Power Law is relatively muted at around 1.4 alpha and the resulting MOIC of around 25x for an outlier startup investment. If the same fund with the same alpha skills (alpha as PnL generating skills) extended its investment horizon to 15 years, the return multiple will increase to 45x accordingly if the funds hit a homerun.
Investment DAOs Friend
Understanding the role of the Power Law behind the dynamics of early-stage investments and acknowledging the implications that it can have on the investment outcomes can help startup investors set themselves up for success. We will derive some key takeaways from the insights above when we addressed the four questions we posed around unicorn spotting rates, expected return multiples, optimal portfolio construction and ideal investment horizon. This setting allows us to formulate a framework that identifies the main drivers of alpha (in this case PnL alpha).
What does all this mean for your alpha (now your PnL alpha)?
- Careful research and diligence in bottom-up investments: This addresses the spotting rate. Simply continuing adding startups to your portfolio in the spirit of “spray and pray” won’t do it. Historically, the top VCs differentiated themselves from their competitors by achieving higher success rates in holding outlier investments in their funds. Miss rates are high for everyone but getting only 1% “right” versus 5% for sitting on 100x investments means a 1x (investors get only their money back) versus a 5x for your portfolio.
- Differentiated support of portfolio companies: Simply cutting checks won’t do it either. Startup investment is not a business about offering a commodity. Investors have to be able to help portfolio companies in a differentiated way, such as leveraging their network or advising them thanks to their personal professional experience and skills.
- Diversification:The Power Law gets some traction only after a certain portfolio size. If the hit rate of finding an outlier with a 100x MOIC is 5% and the portfolio contains 100 startups, on average the fund will have 5 such outliers. If the fund size is only 10, in contrast, hitting a home run becomes more a matter of luck than skill.
- Make time your friend: Removing fixed investment cycle periods can unleash a massive tailwind for your investments. It’s like letting compounding do its work with the exponential growth rates outlier startups are scaling up to. For a 1,000x investment to play out, you need to give the project the necessary time to disruption.
We think that the implications of the Power Law will be particularly beneficial to Investment DAOs. It really boils down to two facts: Investment DAOs can leverage from a vibrant community of crypto enthusiastic members with their depth and width of their skills, and secondly, Investment DAOs with their Treasuries hold a long-term perspective and therefore an accordingly long-term investment horizon. It’s against this backdrop that DAOs will obtain the bandwidth to scale up their investments in numbers, quality, and support for their startups in their portfolio and increase the chance to hit the big homeruns.
References
Technical contributions to Extreme Value Theory
Nassim Taleb (2020). Statistical Consequences of Fat Tails.
MEJ Newman (2005), “Power laws, Pareto distributions and Zipf’s law”, Contemporary Physics.
Alexander McNeil, Ruediger Frey, Paul Embrechts (2005). Quantitative Risk Management.
On Power Law and Venture Capital
Neumann (2015), Power Laws in Venture.
Neumann (2017), Power Laws in Venture Portfolio Construction.
Korver (2018), Picking winners is a myth, but the Power Law is not.
Peter Thiel’s CS183: Startup – Class 7 Notes Essay.
Lahoty (2020), The Power Law in Venture Capital.
Equidam (2016), Average Growth Rates for Startups.
The Quantified VC (2018), How to Win in Venture Capital: Focus on the Fat Tails.
On Lindy


